Excel is a spreadsheet program from Microsoft and a component of its Office product group for business applications. Microsoft Excel enables users to format, organize and calculate data in a spreadsheet.
In this page, we demostrated the use of excel and it's application in finance and data analysis. We explore the use of basic to advanced excel features like advanced excel formulas, pivot tables ,Power Pivot, Power Query and more.
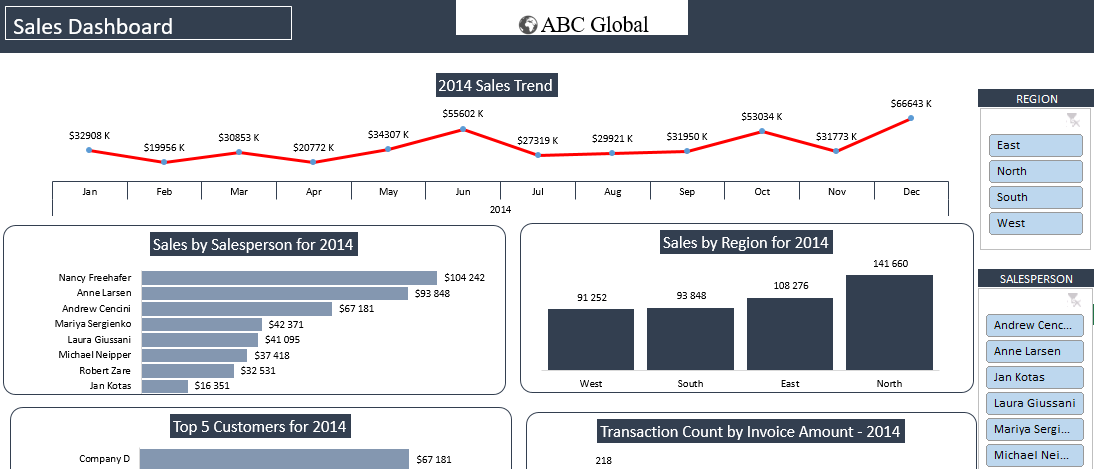
In this project we use Excel pivot tables and pivot charts to analyses sales for ABC Global company. A dynamic Sales Dashboard was created whereby Sales trend, Sales by Salesperson,
Sales by Region, Top 5 Customers and Transaction Count by Invoice Amount were visualized in the dynamic dashboard.
In this project we created excel dashboards for various dataset. To develop those dashboard, we use formulas, Power Query for data wrangling and data manipulation,Power Pivot to create data models.
The Personal Financial Dashboard is a free and interactive excel tool that lets you organize all your finances in one place, so you can see your complete financial picture and make smart money decisions.
You can use it to set goals, create budgets, track spending, and more.
What comes before data analysis is data integrity. Data Cleaning is a significant skill that all Business and Data Analysts must possess.