ABC COmpany Sales
Analysis Dashboard
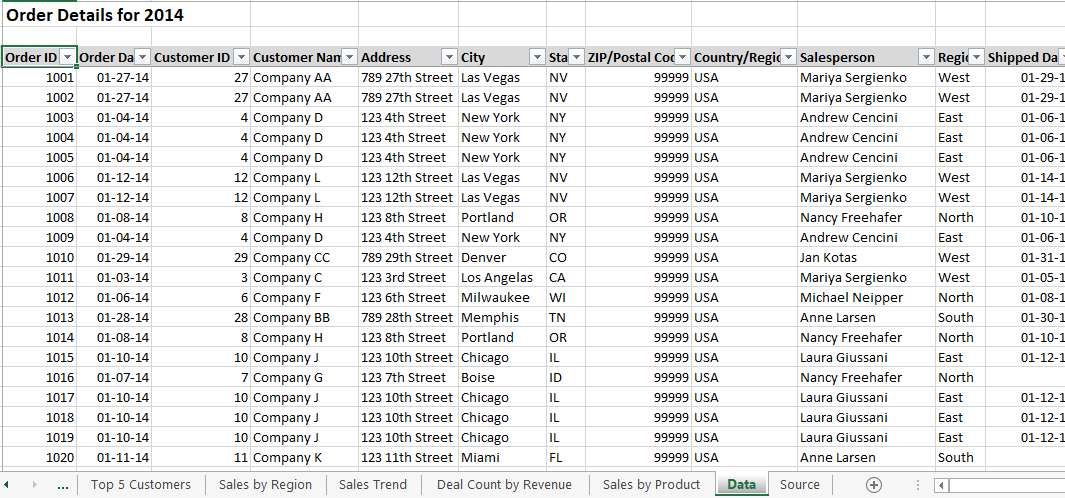
In this project, we design an ABC Company Analysis Dashboard. The data contains order details for the year 2014.
Excel pivot tables and pivot charts were used to perform the analysis.
During the analysis, the following insights were derived:
- Sales Trend for the year 2014
- Sales by Salesperson
- Sales by Region
- Top 5 Customers for 2014
- Count of Transaction by Invoice Amount
1. Sales Trend Analysis for the year 2014
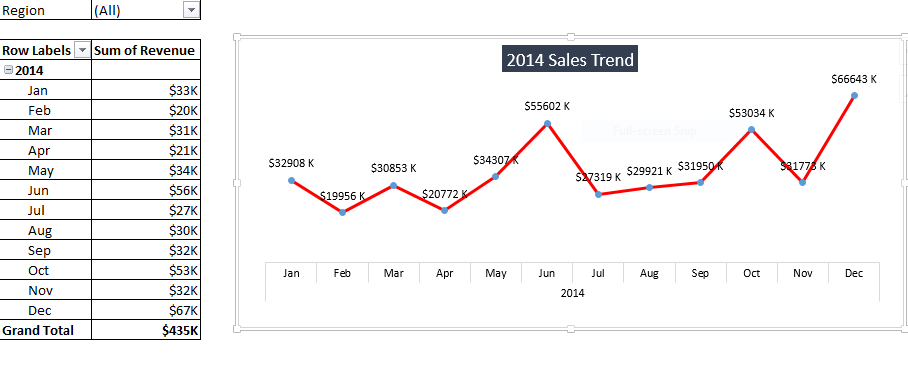
Between the month of April and June, the was a huge growth in sales revenue. The growth rate in revenue for the month of May (34307K) compared to that of April (20772K) was 65.2 %. And the growth rate for the month of June compared to that of April was 167.7 % (55602K) which was almost 3 times as that of April.
Also, between the month of November and December, the company experiences a huge growth in Revenue. The growth rate in revenue for December compared to that of November was 109.7 % which is 220.8 % growth compared to that of April.
2. Sales by Salesperson
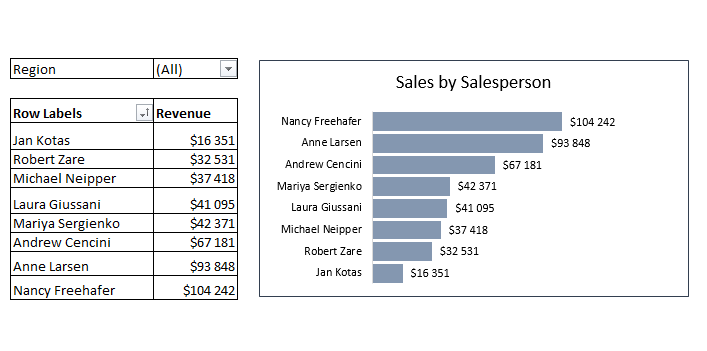
Nancy Freehafer was the highest salesperson with sales amounting to $104 242 with a contribution of 28.8 % of revenue compared to the other salesperson.
Anne Larsen was the second most highest salesperson with total sales amounting to $93 848 with a contribution of 26.0 % of revenue compared to the other sales representatives.
Jan Kotas was the least contributing salesperson with total revenue amounting to $16 351 which is almost 4.5 % of total sales made.
3. Sales by Region
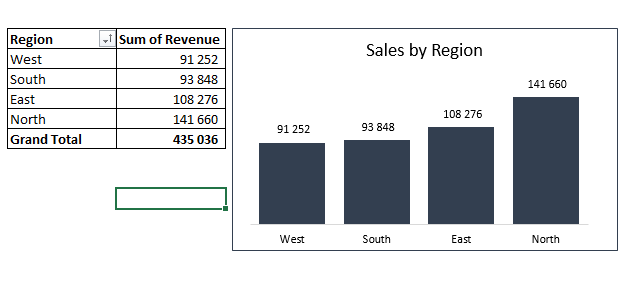
The North region was the most highest selling region compared to the other regions. It contributed sales amounting to $141 660 compared to the other regions. This amount contributed by the North region was 32.6 % more compared to the other regions.
The second most selling region was the East region which made 24.9 % in sales compared to the other regions. The West region was the least region to contribute in revenue with sales amounting to 21.0 % of the total revenue.
4. Top 5 Customers for 2014
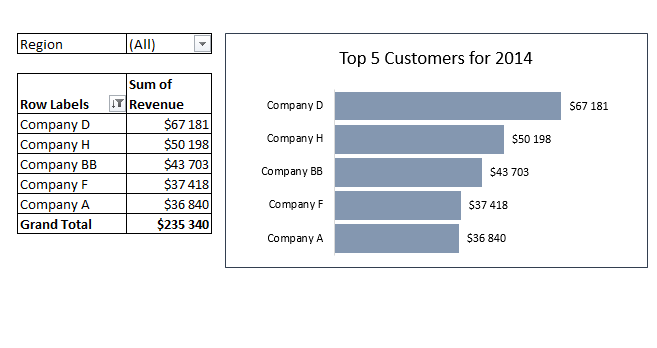
Company D was the most reliable customer in contributing to the company sales. Compared to the other 4 customers, Company D contributed about 28.5 % in ABC Company revenue.
The least customer to contribute into the company revenue was Company A with a total contribution in revenue of 15.7 % when compared to the other companies.
5. Count of Transaction by Invoice Amount
From 0-1000, there were 218 transactions that were made which was almost 59.1 % of total transactions that were made compared to other invoice amounts.
Sales Analysis Dashboard
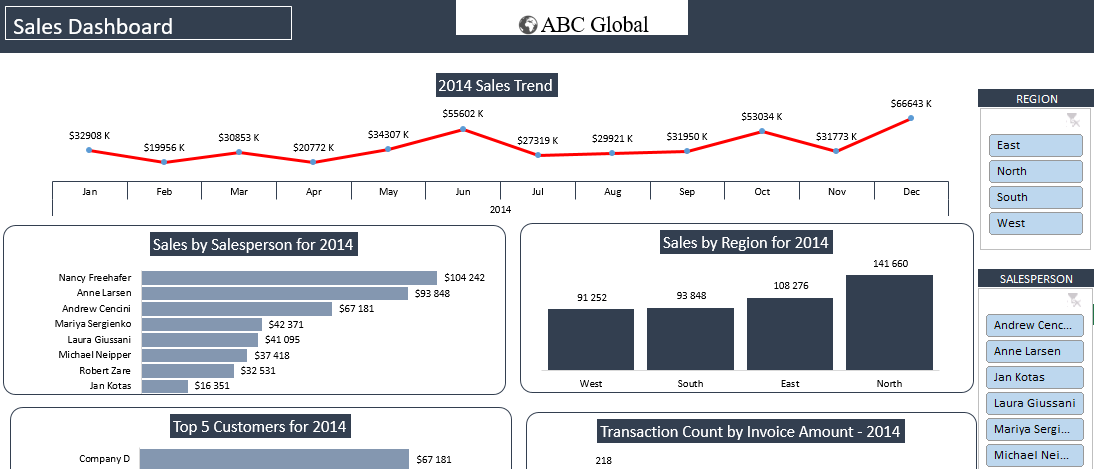
This is the complete dynamic sales dashboard that was created using pivot tables and pivot charts.