Sales Analysis
using Python
In this project, we utilise the power of Pandas a python library that is widely used for data wrangling and data manipulation in order to perform sales analysis on sales data for the year 2019.
After cleaning and sorting the data, the data was plotted using Matplotlib, a python library for data visualization, in order to determine the best month for sales and identifying which city sold the most product.
Also, the suitable time to display advertisements to maximize likelihood of customer's buying product was visualized.
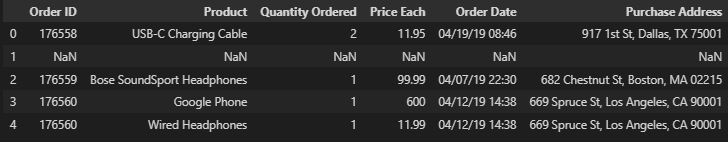
The dataset contains six features or columns namely Order ID, Product, Quantity Ordered ,Price Each, Order Date and Purchase Address.
In order to perform the analysis, the following steps were covered:
- Load the libraries
- Merge CSV files into one file
- Read Updated Dataframe
- Data Cleaning
- Augment data with additional columns
- Data Exploration
- What was the best month for sales? And how much was earned in that month?
- What city sold the most product?
- What time should we display advertisements to maximize likelihood of customer's buying product?
- What products are most often sold together?
- What product sold the most? Why do you think it sold the most?
1. Load the libraries

The os library and pandas library were imported. The OS library was imported to interact with the operating system when changing file directory.
The pandas library was imported for data loading, data manipulation and data wrangling.
2. Merge CSV files into One file
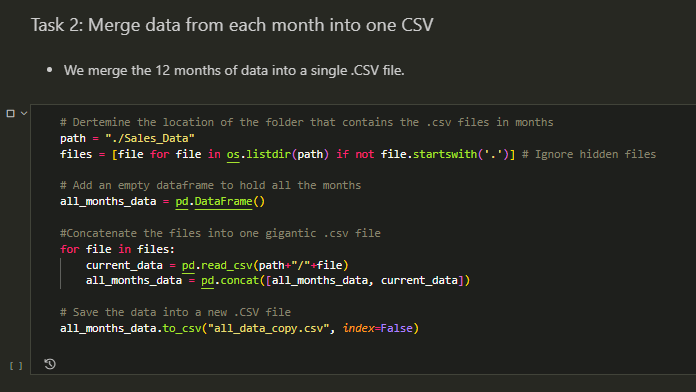
There are twelve files that contains monthly data from January 2019 to December 2019. This individual files need to be merged into a single file. After merging the montly data, the file is saved into a .csv file namely ,all_data_copy.csv
3. Read Updated Dataframe
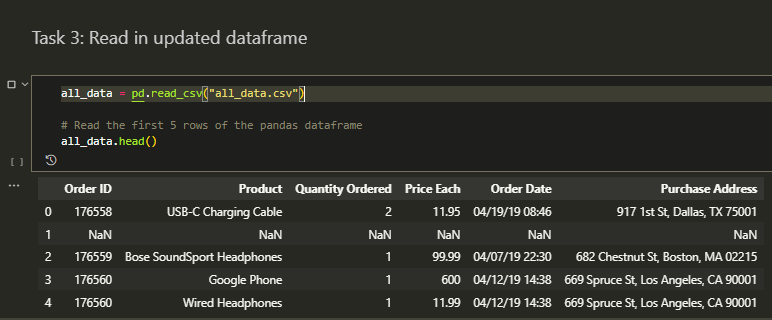
The newly created .csv file , all_data.csv is loaded into pandas dataframe and the first 5 rows of the dataset are extracted using the head() function.
4. Data Cleaning
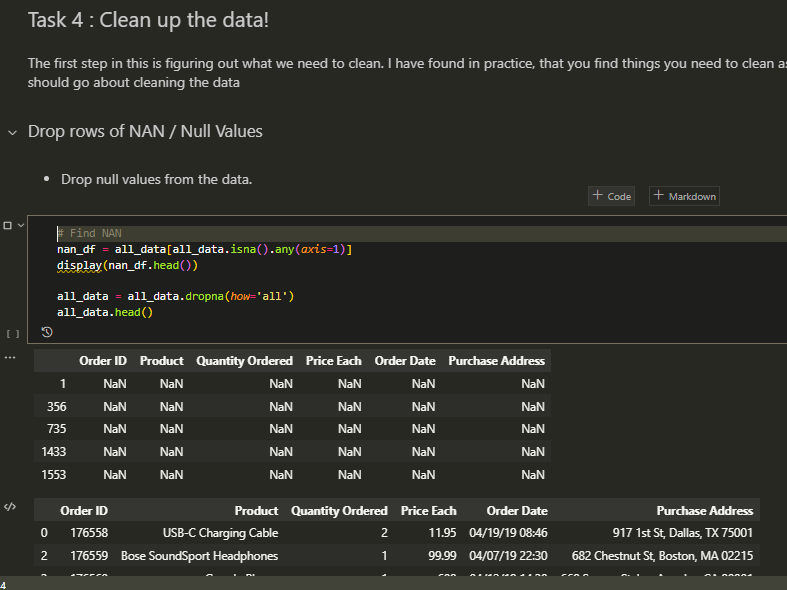
The are some null or empty cells in our datast, so we need to first drop all the Null values. After successfully removing null values, we get rid of text in Order Date column.
Then lastly, we change the type of the columns Quantity Order and Price Each to numeric
5. Augment data with additional columns
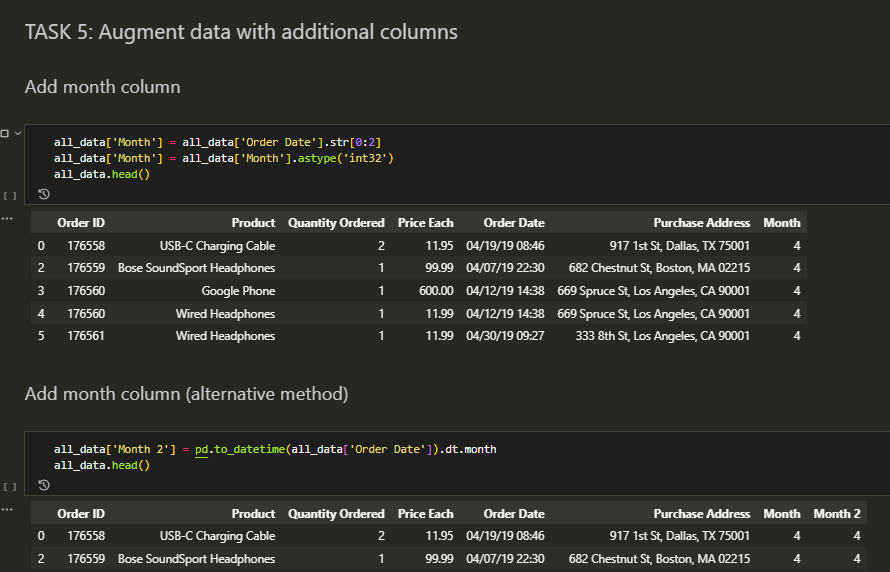
In this task, we extracted the month from the Order Date and created a new column called Month.
After creating the new column , Month, we added a new column called city which was extracted from Purchase Address column.
6. Data Exploration
During data exploration, the following questions were raised:
- What was the best month for sales? And how much was earned in that month?
- What city sold the most product?
- What time should we display advertisements to maximize likelihood of customer's buying product?
- What products are most often sold together?
- What product sold the most? Why do you think it sold the most?
1. What was the best month for sales? And how much was earned in that month?
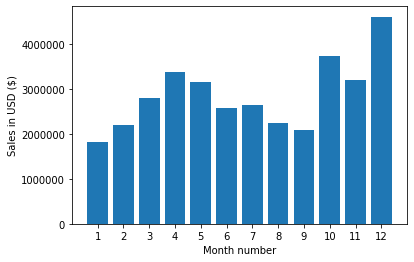
According to our analysis, the best month for sales was December. The sales that were made on that month alone were $4 613 443.
2. What city sold the most product?
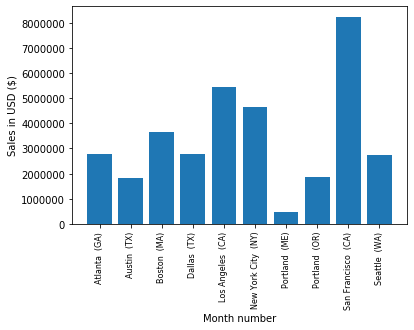
San Francisco (CA) was the most selling city with products sold amounting to $8 262 204.
3. What time should we display advertisements to maximize likelihood of customer's buying product?
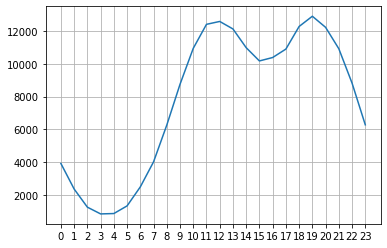
The recommended time for displaying advertisements is before 11 a.m and before 7 p.m.
4. What products are most often sold together?
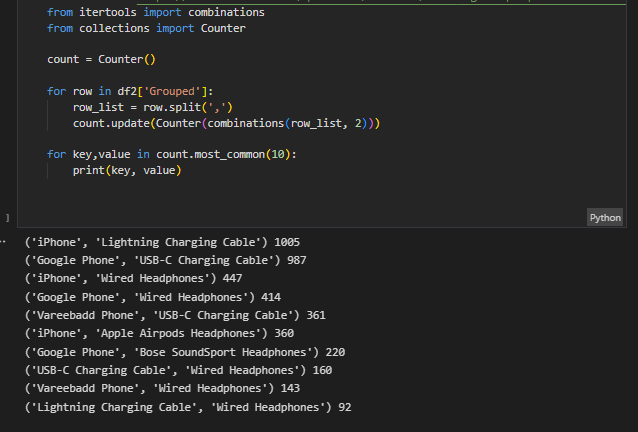
The products that sold often are iPhone and Lighting Charging Cable worth 1005 units sold.
5. What product sold the most? Why do you think it sold the most?
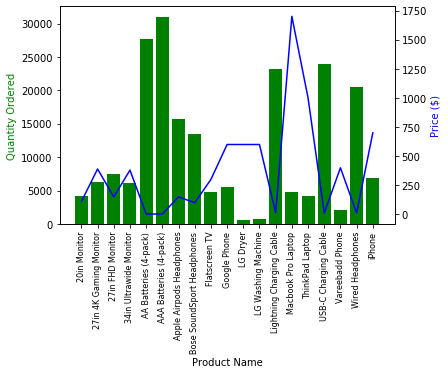
The product that sold the most was Macbook Pro Laptop. The reason it sold the most is because it is affordable or doesn't cost that much in terms of Price.