Sales Performance Dashboard
WITH Power BI
In this project a sales analysis dashboard was created. The folowing calculations were displayed:
- Average Discount
- Average Quantity in Sales
- Total Sales
- Total Profit
Also, the following plots were displayed to aid in the sales analysis.
- Number of Orders
- Profit in bins in 1000
- Sales by Segment and Category
- Customer Profit vs Sales
- Percentage of Orders by Region and Category
- Percentage Profit by Category
Let us go through the analysis
1. The dataset
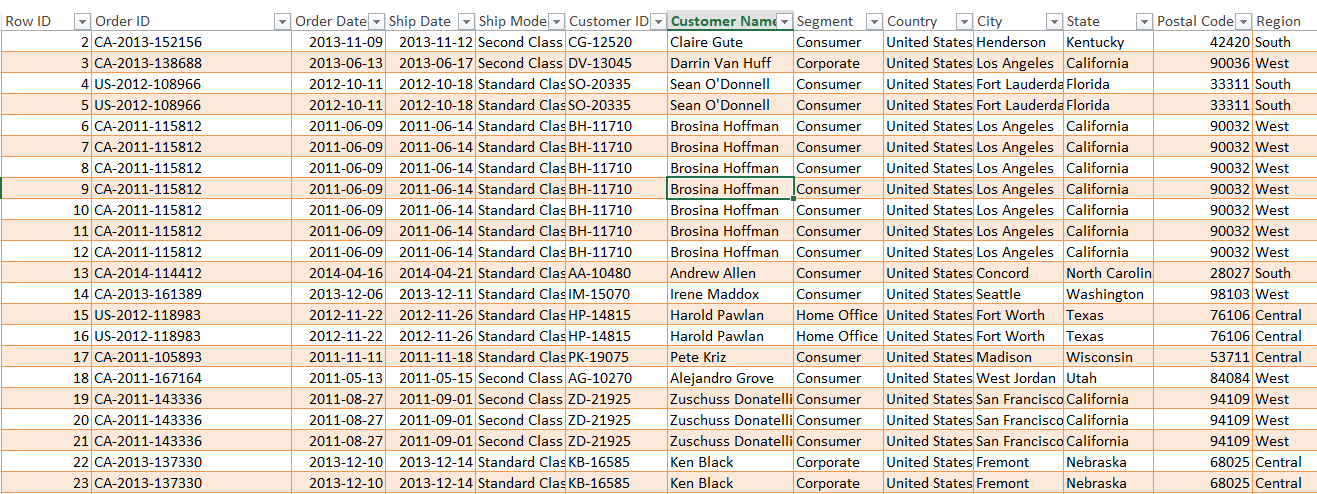
The dataset contains 21 attributes or columns. These are the Row ID, Order ID, Order Date, Ship Date, Ship Mode, Customer ID, Customer Name, Segment, Country, City, State, Postal Code, Region, Product ID, Category, Sub-Category, Product Name, Sales, Quantity, Discount and Profit.
2. Average Discount in Sales, Average Quantity , Total Sales and Total Profit
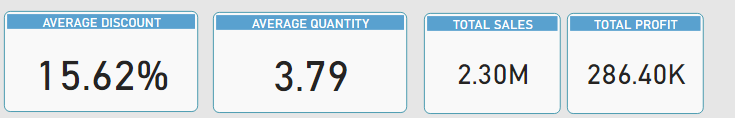
On average , the dicount on sales made was 15.62 %. And on average , the quantity of products sold was estimated to be around 3.79.
The company sales were estimated to be around 2.30M in total.
In the 2.30M total sales made, the comapny made a total profit estimated to be around 286.40K.
3. Number of Orders
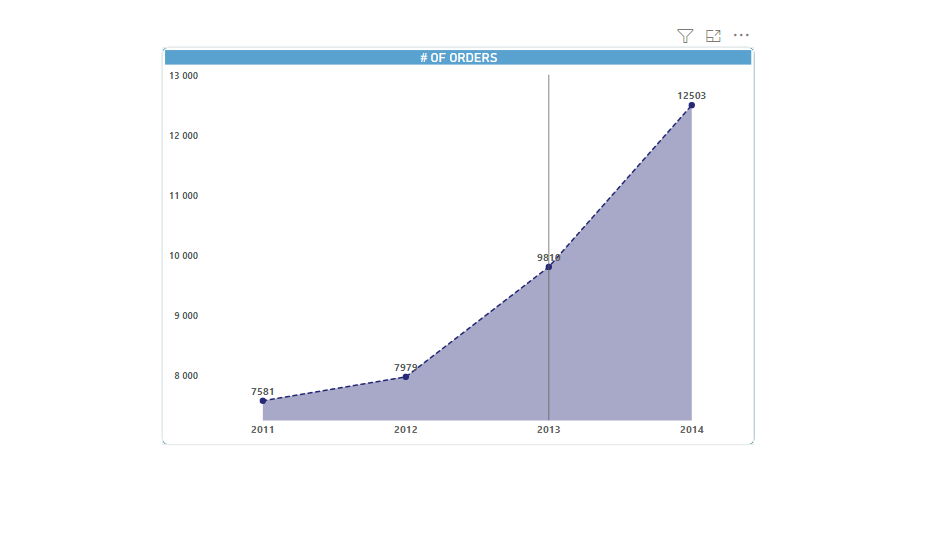
According to the line graph above, the growth rate in Number of Orders inbetween years is as follows:
- Between the year 2011 and 2012, the growth rate in number of orders was around 5.25%
- Between the year 2012 and 2013, the growth rate in number of orders was approximately 22.95%
- Between the year 2013 and 2014, the growth rate in number of orders was around 27.50 %
4. Sales by Segment and Category
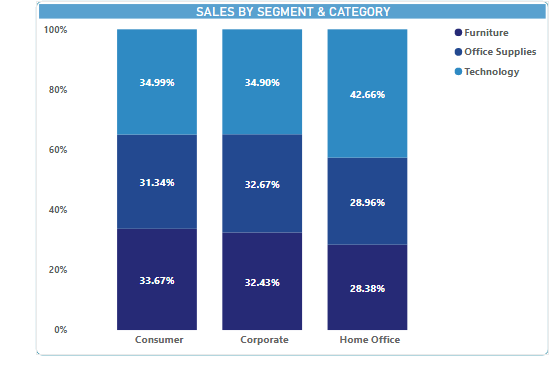
According to the stacked bar chart, there were three segment namely Consumer, Corporate and Home Office. This segment hag varying percentage sales.
There are also three categories namely Furniture , Office Supplies and Technology.
- Furniture
- Office Supplies
- Technology
The Consumer segment made about 33.67% in sales of Furniture. The sales made by the Corporate segment were slightly less than that of Consumer segment with percentage sales in Furniture estimated to be 32.43%. And the least segment in the group, Home Office, made a mere estimate of 28.38% in sales of Furniture.
The Consumer segment made an estimate of 31.34% in Office Supplies sales, which is slightly below that of Corporate segment which was 32.67%. The least sales percentage sales was from the Home Office segment with an estimate of 28.96% in sales.
Toping the list in percentage sales is Home Office segment with an estimate of 42.66%. There was a very slight difference in sales between the Corporate and Consumer segment whereby the sales in percentage was 34.90% and 34.99% respectively.
5. Customer Profit per Sales
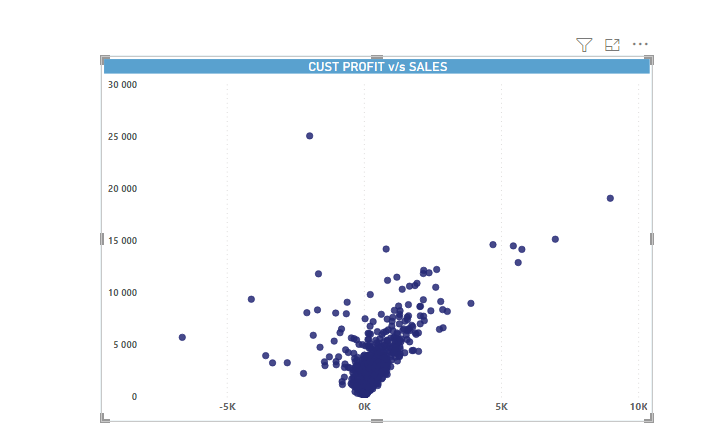
On the x-axis is the profit made per customer and on the y -axis are the sales. In the scatter plot, it seems like the profit made from the sales mostly fall within the range of -5K to 5K.
6. Percentage of Orders by Region and Category

According to the horizontal stacked bar chart, there were there are four regions namely West, East, Central and South. This regions had varying sales in percentages.
Sales Performance Dashboard
The figure below is the complete Sales Perfomance Dashbaord.
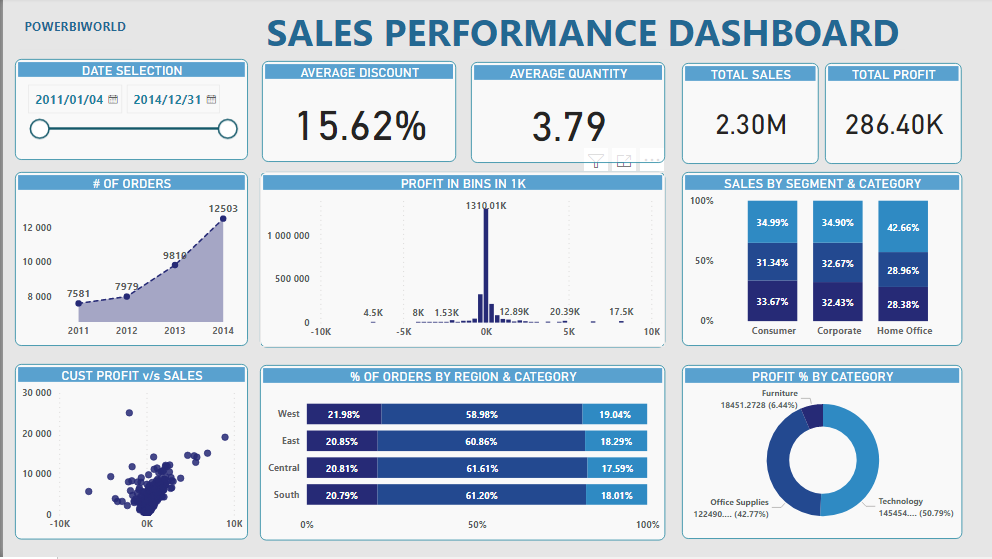
Also click Here to access the static file of the dashboard.
Back To Page